Quick Answer
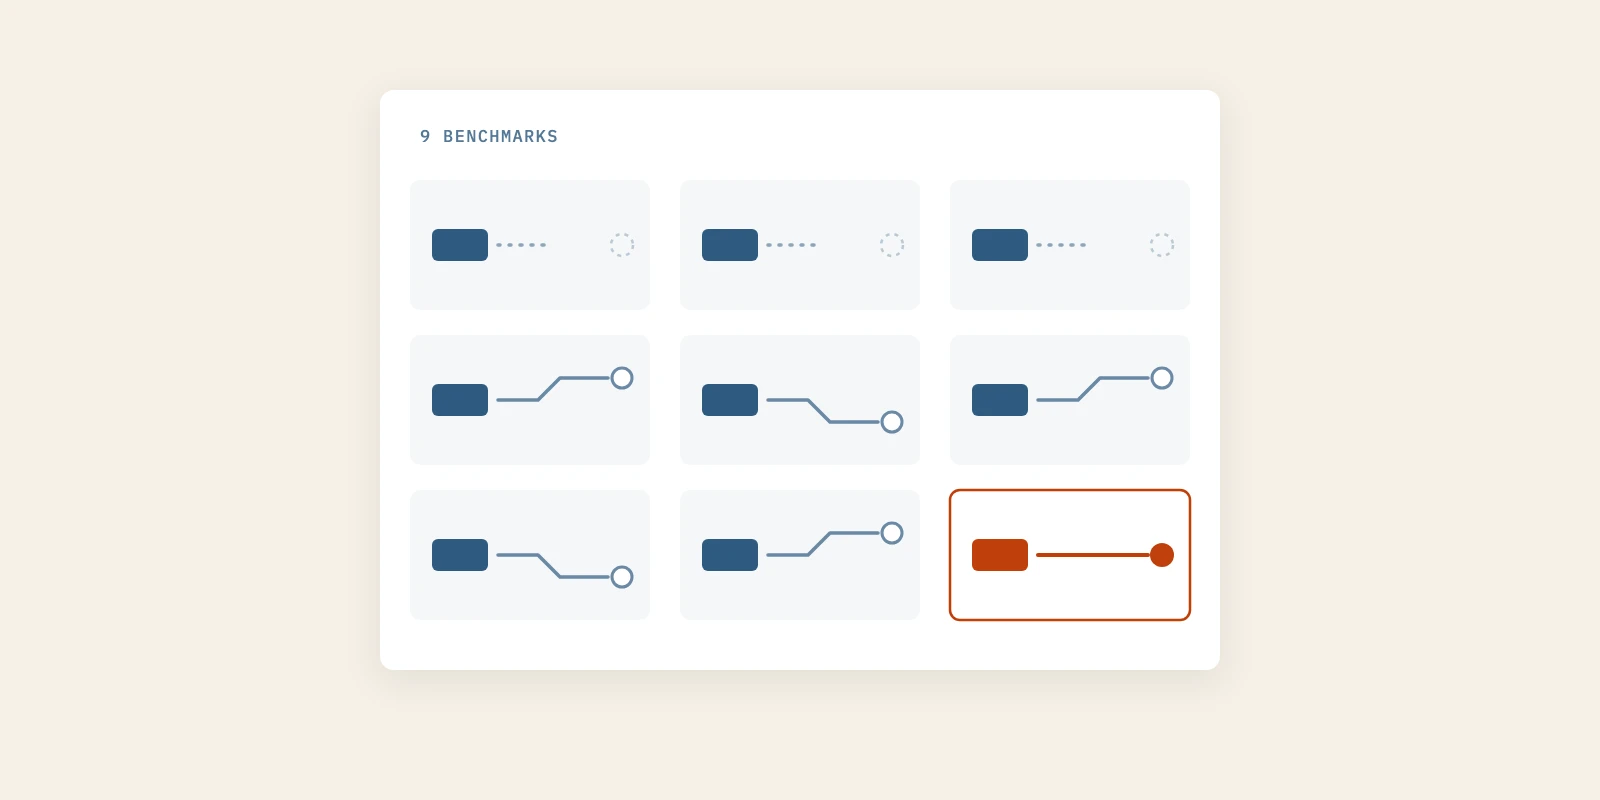
Most widely quoted SaaS benchmarks do not survive a trace back to their primary source. Of nine we followed, three rest on no study at all, five come from real work that lost its sample, date or scope in transit, and one held up because its author shows the arithmetic. Before a number goes into a deck or a page, find the original document, check who was measured, and confirm the claim still says the same thing.
In February 2015, Brad Feld wrote up something he had heard at a board meeting. A late-stage investor had described a 40% rule for healthy software companies, and Feld scoped it to companies at scale, with at least 50 million dollars in revenue.
That is the whole origin of the Rule of 40. Eleven years later it sits in seed decks and board reviews for companies nowhere near that floor, and nothing in between gave it more evidence. It only gained repetition.
The same pattern runs through a lot of content marketing for tech companies, because a confident number is the easiest thing to borrow. This covers the four-step trace we ran, what it found for each of nine benchmarks, and the five checks worth running before you publish one.
How to Trace SaaS Benchmarks Back to a Primary Source
You trace SaaS benchmarks by following each citation one hop at a time until you reach a primary source or run out of chain. The method needs no tools beyond a search box and patience, and you can run it on any number before it goes in a deck.
- Find the earliest use you can reach. Search the exact phrasing rather than the topic, because the oldest instance is usually an ugly PDF or a slide, not the best-written article.
- Follow every citation one hop at a time. Most chains break on the second or third hop, where a blog cites an aggregator that cites a vendor that cites the blog.
- Sort what you find into three buckets: no source exists, a source exists but says something different, or a source exists and is a self-reported survey.
- Check whether the scope survived. Most of the damage isn't fabrication. It's a real finding, measured in a narrow context, that lost its qualifiers along the way.
Write each hop down as you go. Circular citations only become visible when you can see the shape of the chain, and a loop looks like corroboration until you draw it.
The third bucket matters more than it sounds. A self-reported survey is still a primary source, but it measures what people believe about their results, not the results.
Where Nine Widely Quoted SaaS Benchmarks Actually Come From
Nine SaaS benchmarks, traced to source, split three ways: three with no study underneath, five that are real but arrived distorted, and one that held up. Each trace below names the furthest document we could reach and what it actually says.
We re-ran every trace for this version of the page. One verdict changed and one trace was corrected, and both are noted where they appear.
1. The Rule of 40 Began as One Investor's Rule of Thumb
The rule says a software company's growth rate plus its profit margin should add up to 40 percent. Brad Feld's February 2015 post is the earliest written source, and it relays an unnamed investor at a board meeting, scoped to companies with at least 50 million dollars in revenue.
Tomasz Tunguz checked it about a week later, calculating the metric for public SaaS companies by years since founding. The median fell from above 100 percent to about 30 percent over roughly fifteen years, and he concluded it might be a fair filter for later-stage investors while early-stage founders should watch unit economics instead.
That second half is a correction to our earlier version, which read the check as a rejection. The honest verdict is narrower: no study sits behind the Rule of 40, and the one early data check supported it only for companies at scale.
2. The Five Times Retention Claim Has No Findable Study
The claim that acquiring a customer costs five times more than keeping one has no primary source anyone has produced. An Ipsos Loyalty excerpt from the book Loyalty Myths traced its earliest sources to the Technical Assistance Research Project in Washington in the late 1980s, while at least three other organizations claimed the same finding as their own.
From there it reached a 1990 Harvard Business Review article on service recovery and Tom Peters' Thriving on Chaos. By 2014 an HBR post was quoting it as anywhere from five to 25 times, depending on which study you believe and which industry you're in.
A range that wide is an admission that the studies are unnamed. Customer retention may well be cheaper in your business, but this number is not the evidence for it.
3. The 67 Percent Blogging Lead Claim Ends at an Infographic
"Companies that blog get 67 percent more leads" is credited to Demand Metric on page after page, including roundups dated 2026. Follow it and the trail stops at a Demand Metric infographic described as 35 statistics and best practices, behind a download, with no methodology on the page.
The wording also drifts as it travels, from companies that maintain a blog to companies with blogs producing more leads each month. Those are different measurements wearing one number.
We write content for a living and think blogging does produce leads. The 67 percent figure just isn't the proof, because nobody citing it has shown the study it came from.
4. The Five Follow-Ups Claim Traces to a 1942 Survey
"80 percent of sales are made on the fifth to twelfth contact" usually arrives credited to The Marketing Donut or the National Sales Executives Association. The Marketing Donut page that searches for it still surface now returns a 404.
This verdict changed, because our earlier version found no source at all. Sales and Marketing Executives International, the association's current name, says its archives trace the figures to a 1942 survey by its Long Island chapter. Members were asked about calls made against sales made, and the sample was under 40.
So a source exists, and it is an 84-year-old member survey of fewer than 40 people. One sales deck by Jeroen Corthout cites the breakdown as "a popular sales meme", which is closer to the truth than most citations get.
5. The 25 to 95 Percent Retention Profit Range Grew in Transit
The claim that 5 percent more customer retention lifts profits by 25 to 95 percent does come from real work. Reichheld and Sasser's 1990 Harvard Business Review article, Zero Defections, is the source. Its abstract says cutting defections by 5 percent raised profits 85 percent in one bank's branch system, 50 percent in an insurance brokerage and 30 percent in an auto-service chain.
Bain's own 2001 note by Reichheld puts it more cautiously: in financial services, more than a 25 percent increase in profit. The 25 to 95 percent range is the version a 2014 HBR post carries, and it is the one now quoted without industries attached.
We could read the abstract, not the full paper, so we can't say the 95 never appears in it. What we can say is that the version in circulation is wider at the top than the named examples and has lost the three industries that produced them.
6. The 42 Dollar Email Return Was 42 Pounds, Self-Reported
Email "returns 42 dollars for every dollar spent" comes from the DMA Marketer Email Tracker 2019. The report's chart shows 42.24 pounds, and its methodology describes an online survey of 197 UK marketers in January 2019, estimating their own return on investment.
The DMA's 2021 tracker put the estimate at 38.33 pounds. So the figure in circulation is one year's high point, from one country, in a currency it has been quietly converted out of.
That makes it a finding about what 197 UK marketers believed their email earned. It is a real primary source, used as though it were a measured return for everyone.
7. The 3:1 LTV to CAC Ratio Was a Guideline With a Stage Caveat
The rule that lifetime value should be at least three times customer acquisition cost traces to David Skok's SaaS Metrics 2.0 guide on his For Entrepreneurs blog. Skok presents it as a guideline, and writes that his early guesses held up once he checked them against many SaaS businesses over two years.
That is practitioner judgment, not a published dataset. Skok later introduced a guest post on the same blog by saying he had made a significant mistake in not telling readers when it made sense to compute LTV and CAC at all.
His point was that before a repeatable, scalable sales process exists, the inputs are too unstable to trust. The distortion is the universal version: a guideline for companies with a working sales motion, applied as a pass-fail test at seed.
8. The 57 Percent Buyer Journey Figure Rests on an Unpublished Survey
The claim that B2B buyers are 57 percent through a purchase before contacting sales comes from CEB's Marketing Leadership Council. It appears in The Digital Evolution in B2B Marketing, a report co-sponsored by Google. The report describes a survey of more than 1,500 customer contacts for 22 large B2B organizations.
In 2012 Jeffrey Josephson of the telemarketing firm JV/M tried to obtain the underlying 2011 survey. He followed the citations through several CEB presentations, then phoned the council, where a search of its studies found nothing under that title.
If a B2B demand generation agency opens a pitch with the 57 percent figure, ask which survey it comes from. The honest answer is a sample drawn from 22 large companies' customers, with data nobody outside CEB has published.
9. The 95:5 Rule Survived Because It Shows the Working
The 95:5 rule says only about 5 percent of business buyers are in the market at any given time. It traces cleanly to John Dawes of the Ehrenberg-Bass Institute, written for LinkedIn in 2021 and co-published in Marketing Week.
It survives because Dawes derives it in the open. Companies change providers such as their main bank or law firm about every five years, so about 20 percent are in the market in a year and about 5 percent in a quarter.
He also labels it plainly: "The 95% figure is not meant to be a precise rule." A number that explains its origin can be checked and adjusted for your category, which is exactly what the other eight made hard.
The Nine SaaS Benchmarks Compared by Verdict at a Glance
Laid side by side, the nine SaaS benchmarks show a pattern: the problem is rarely invention. Mostly a real finding lost the context that made it true.
| Benchmark | Furthest source reached | Verdict |
|---|---|---|
| Rule of 40 | Brad Feld, 2015, relaying one investor | No study behind it |
| Five times cheaper to retain | Late-1980s attribution, per Ipsos | No study behind it |
| Blogs bring 67 percent more leads | Gated Demand Metric infographic | No study behind it |
| 80 percent need five follow-ups | 1942 chapter survey, under 40 people | Real but distorted |
| Retention lifts profit 25 to 95 percent | Reichheld and Sasser, HBR 1990 | Real but distorted |
| Email returns 42 per 1 | DMA 2019, 197 UK marketers | Real but distorted |
| 3:1 LTV to CAC | David Skok, SaaS Metrics 2.0 | Real but distorted |
| Buyers 57 percent through | CEB with Google, 22 organizations | Real but distorted |
| 95:5 rule | John Dawes, Ehrenberg-Bass, 2021 | Held up |
One row moved since the first version of this page. The follow-up claim went from no source to a real but tiny 1942 survey, and the Rule of 40 kept its verdict while its one data check turned out friendlier than we had described.
Why AI Answers Spread Distorted SaaS Benchmarks Faster
AI answers spread distorted SaaS benchmarks faster because they return the most repeated version of a number and drop the chain behind it. No hop count, no sample, no year, and no note that a range is wide because the studies are unnamed.
Several of the pages still repeating these figures are roundups dated 2026, crediting studies nobody has shown. When an assistant retrieves those pages, the answer inherits the gap, and that answer gets pasted into a new post that becomes retrieval material for the next one.
We've written about how answers are replacing clicks in search, and this is one of the less obvious costs. A distorted number used to spread at the speed of blog posts, and now it spreads at the speed of answers.
The same mechanism works in your favor if you show your working. A page that states where a number came from and what it doesn't cover gives a model something specific to quote, which is most of what it takes to get cited by AI rather than paraphrased.
That is the standard Better Marketing holds pages to when the goal is being found on Google and cited inside AI answers. Any AI SEO service worth hiring should be able to tell you where every number on your pages came from.
When Quoting Untraced SaaS Benchmarks Is Still Reasonable
Tracing every number is not always worth the hours, and some untraced SaaS benchmarks are fine to use if you label them. The tactic has limits, and it helps to know where they are.
- Internal planning, where a rough rule of thumb beats no target at all and nobody outside the room will quote it.
- Stating a belief as a belief. "Many investors screen on the Rule of 40" is true and useful, even though the rule has no study behind it.
- Numbers you will replace with your own. A borrowed customer acquisition cost target is a reasonable starting guess until your first cohorts report.
Where it stops being reasonable is anywhere a buyer, investor or model will lift the number as fact. A page, a pitch or a sales email is exactly that place.
Five Checks to Run on SaaS Benchmarks Before You Publish
Run these five checks on any SaaS benchmarks before they go into a page, a deck or a pitch. They take minutes for most numbers and catch every failure in the table above.
- Can you reach a primary source in three hops? If not, drop the number or label it as a rule of thumb.
- Does the source say what the citation says? Check the figure and the population, which is where the retention and email numbers both fail.
- Who was measured, and how many? 197 self-reporting UK marketers is a finding about 197 self-reporting UK marketers.
- What year, and has the source revised it since? The DMA's own later tracker put its email estimate lower.
- Did the scope survive? The Rule of 40 had a 50 million dollar floor that most people quoting it are nowhere near.
This is the habit that separates content marketing for tech companies that earns trust from content that borrows it. It also matters when you hire help, since an AI SEO service or a writer who can't show sources will pass the distortion straight to your buyer.
Check One Benchmark Before Your Next Pitch Deck
Pick the one number your deck or homepage leans on hardest, and trace it before your next investor or buyer meeting. If it survives, cite the primary source by name; if it doesn't, say what people assume instead.
Trust is built in specifics, never in slogans. Better Marketing builds outreach on claims a buyer can check, and that is the work a B2B demand generation agency should be judged on. If you find a primary source for any of the three SaaS benchmarks we couldn't trace, tell us and we'll correct this page.