Quick Answer
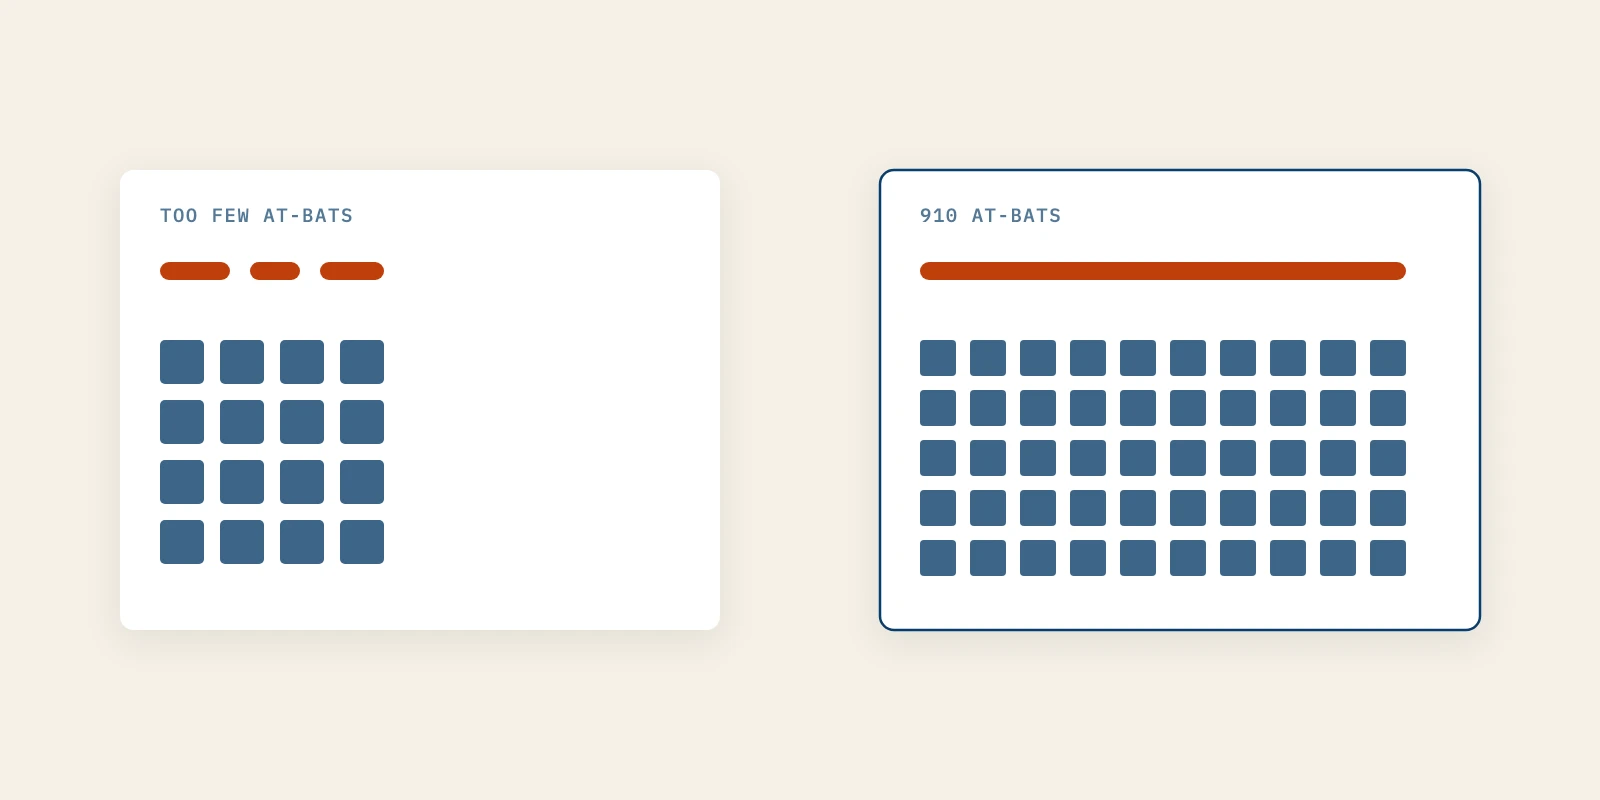
Sample size decides which marketing numbers you are entitled to read. Simple yes-or-no events like opens, clicks and replies settle on a small sample, while customer conversion and cost per acquisition need far more volume before signal separates from noise. Baseball worked this out first: a hitter's strikeout rate becomes reliable after about 60 plate appearances, and batting average, the number everyone quotes, needs 910 at-bats.
Founders kill channels on evidence that would not convict anyone. Four newsletter issues, nine blog posts, thirty cold emails, and the verdict is in.
Baseball ran into the same problem and did the arithmetic instead of arguing about it. Russell Carleton put a number on how much data each hitting statistic needs before it stops being mostly noise, and the ordering is uncomfortable. The statistic fans quote most often turns out to be the one that needs the most.
Marketing has the same shape, which is why the number you care about is the last one you can trust. This covers the sample size each kind of marketing signal needs, the arithmetic that produces it, and the point where the baseball comparison stops holding.
What Sample Size a Marketing Channel Needs Before You Judge It
A marketing channel needs the sample size demanded by the one metric you plan to judge it on, and that is a different number for every metric on the same channel. Choose the metric, calculate the sample size it needs, then set the review point. Doing it in that order is the whole method.
The arithmetic is old and it is not hard. Lehr's approximation sizes each of two equal groups as 16 divided by the squared standardized difference. That constant assumes 80 percent power at a two-sided significance level of 0.05, as a primer on sample size in the Indian Journal of Dermatology sets out.
For a yes-or-no rate, that reduces to something you can work out on paper.
n ≈ 16 × p(1 − p) / d²
Here p is the rate you have today and d is the smallest change you would act on. The answer is the sample size per group, so you need that many in the version you are testing and that many again in whatever you are comparing it against.
1. Name the Signal That Should Move First
Pick the single event that changes earliest if the channel is working at all. For a newsletter that is the open or the click, for cold outreach it is the reply, and for a blog it is the page getting crawled and then read to the end.
Write it down before the first send, because a metric chosen after the results are in is chosen to flatter them. If you cannot name one event that should move inside the first month, the channel has no leading indicator and you have bought a longer wait than you think.
2. Calculate the Sample Size That Metric Needs
Put your current rate and the smallest change worth acting on into the formula above. A newsletter opening at 40 percent, tested for a five-point move, needs about 1,536 sends per group, or roughly 3,072 in total.
Low base rates are where this turns expensive. A 3 percent click rate tested for a one-point move needs about 4,656 per group, or 9,312 sends altogether, which is more volume than most early lists produce in a year.
The common mistake is running the calculation after the test and treating it as a post-mortem. Run it first and it is a budget, because it tells you what the decision will cost before you spend anything on it.
3. Set the Review Date Before You Start
Convert the sample size into a date using your real sending or publishing rate, then put that date in the calendar. A list of 800 people mailed weekly reaches 3,072 sends in about four weeks, so a review in week two is not a review, it is an opinion with a chart attached.
The failure here is reviewing on a cadence rather than on a sample. Monthly reporting feels disciplined and produces a verdict every month, even in months that generated nowhere near enough data to support one.
4. Cap the Cost While the Outcome Stays Unreadable
Set a spend limit and a time limit for the stretch before the outcome metric can be read, and treat overrunning either one as the kill signal. That is a decision you can make on a sample of one, because cost is not a noisy measurement.
It also protects the channels that deserve more time. A blog nine posts in has produced nothing that can settle a question about pipeline, but it has produced plenty of evidence about what publishing costs you, and that evidence is already readable.
Baseball Put a Number on Every Statistic It Trusts
Baseball answered the sample size question by measuring rather than arguing. Russell Carleton's Baseball Prospectus study, published in July 2012, used the Kuder-Richardson reliability formula to find the point at which a hitter's numbers correlate with themselves at 0.70, which puts roughly half the variation on the signal side.
Those published thresholds run in an order that surprises most people:
- Strikeout rate, about 60 plate appearances.
- Walk rate, about 120 plate appearances.
- Isolated power, about 160 at-bats.
- Home run rate, about 170 plate appearances.
- Slugging, about 320 at-bats.
- On-base percentage, about 460 plate appearances.
- Batting average on balls in play, about 820 balls in play.
- Batting average, about 910 at-bats.
Strikeout rate reads after about 60 plate appearances. Batting average needs 910 at-bats, more than fifteen times as many chances at the plate. It is the number printed on the back of the card, the one a whole sport argued about for a century before anyone checked how much data it required.
The ordering is not arbitrary. A metric counting one repeated yes-or-no event settles quickly, and a metric folding in luck, sequencing and context settles slowly, because every extra source of variation has to average out before the underlying rate shows through. It is the same failure we found tracing nine widely quoted SaaS benchmarks back to their sources, except that here the unreliable number is your own.
Fast Signals and Slow Signals Differ in What They Prove
Fast signals prove a channel is functioning. Slow signals prove it is worth money, and only the second question has a budget riding on it.
| Signal | What It Counts | Sample Size Before It Reads |
|---|---|---|
| Open rate | One yes-or-no event per send | About 1,500 per group for a five-point move at 40 percent |
| Click rate | The same event at a much lower base rate | About 4,700 per group for a one-point move at 3 percent |
| Customer conversion | A chain of events, each one adding variance | More than either, and more than most early teams ever reach |
The first two rows describe the same mechanic and differ only in base rate, and the rarer event costs roughly three times the volume. Rare events are expensive to measure, and almost everything a founder wants to know is a rare event.
Statistical significance is only the formal name for the line between those rows. It says the result is larger than the variation your sample size could have produced by itself, which is a claim about evidence rather than a claim about the channel.
So the reverse of the sensible order is what usually happens. The leading indicator gets ignored because it feels shallow, and the conversion rate gets acted on because it feels important, at the exact moment it has the least to say.
What to Read While the Outcome Metric Is Noisy
Read the events that have already cleared their own sample size, and read cost. The job is not patience as a virtue, it is sequencing. Neither of those readings asks you to pretend the outcome number means something yet.
For a newsletter that is open rate, click rate, reply quality, unsubscribes and hours per issue. For outreach it is reply quality and meeting rate, which tell you if the message lands well before revenue can tell you anything at all.
Content is the slowest of the three. The number you want is pipeline, and pipeline is last in the queue, behind crawling, indexing, impressions and clicks. An AI SEO service shows crawl and indexing movement within weeks, while the rankings and AI citations it exists to produce are quarters away.
Content marketing for tech companies gets judged early more often than anything else, which is why Better Marketing runs a B2B demand generation agency on months rather than weeks. The outreach inherits the trust the content built, and the sample size arrives along with it.
The same arithmetic applies to one prospect as well as a whole channel, which is the subject of how many attempts a single buyer needs. A launch week is the mirror-image error, a spike big enough to look like proof and too short to be a sample, which is what the launch spike hides.
Where the Baseball Analogy Stops Holding for Marketing
The analogy breaks wherever the thing being measured changes while you measure it. Marketing changes constantly. A stabilization point assumes a roughly stable underlying rate, and a campaign you are actively rewriting does not have one.
Baseball has already found this inside its own data. Amanda Glazer's 2025 paper on changepoint detection in player performance reports that “for some metrics, more than 60% of detected changes occur in-season”. If that holds for hitters, whose talent moves slowly, it holds harder for a founder who rewrote the offer last Tuesday.
Carleton has spent years pushing back on the cutoff charts his own work produced, in pieces including one titled Please Stop Talking About Statistical “Stabilization”. A statistic does not switch on at a threshold, it gets gradually less noisy, and a sample size number is a decision aid rather than a law of nature.
So do not import baseball's numbers. Import the habit of asking what the sample size supports before reading the number, and accept that in marketing the honest answer moves every time you change the product, the message or the list.
Ask What the Sample Size Supports, Then Decide
Before you kill a channel, ask one question. Is this the metric my sample size can carry, or am I reading the number I want rather than the one I have earned?
Name the early signal, size it, date the review, cap the spend. That sequence is how Better Marketing runs an AI SEO service, where the crawl moves in weeks and the citations take quarters, and it is how you stop mistaking early silence for failure.