
Quick Answer
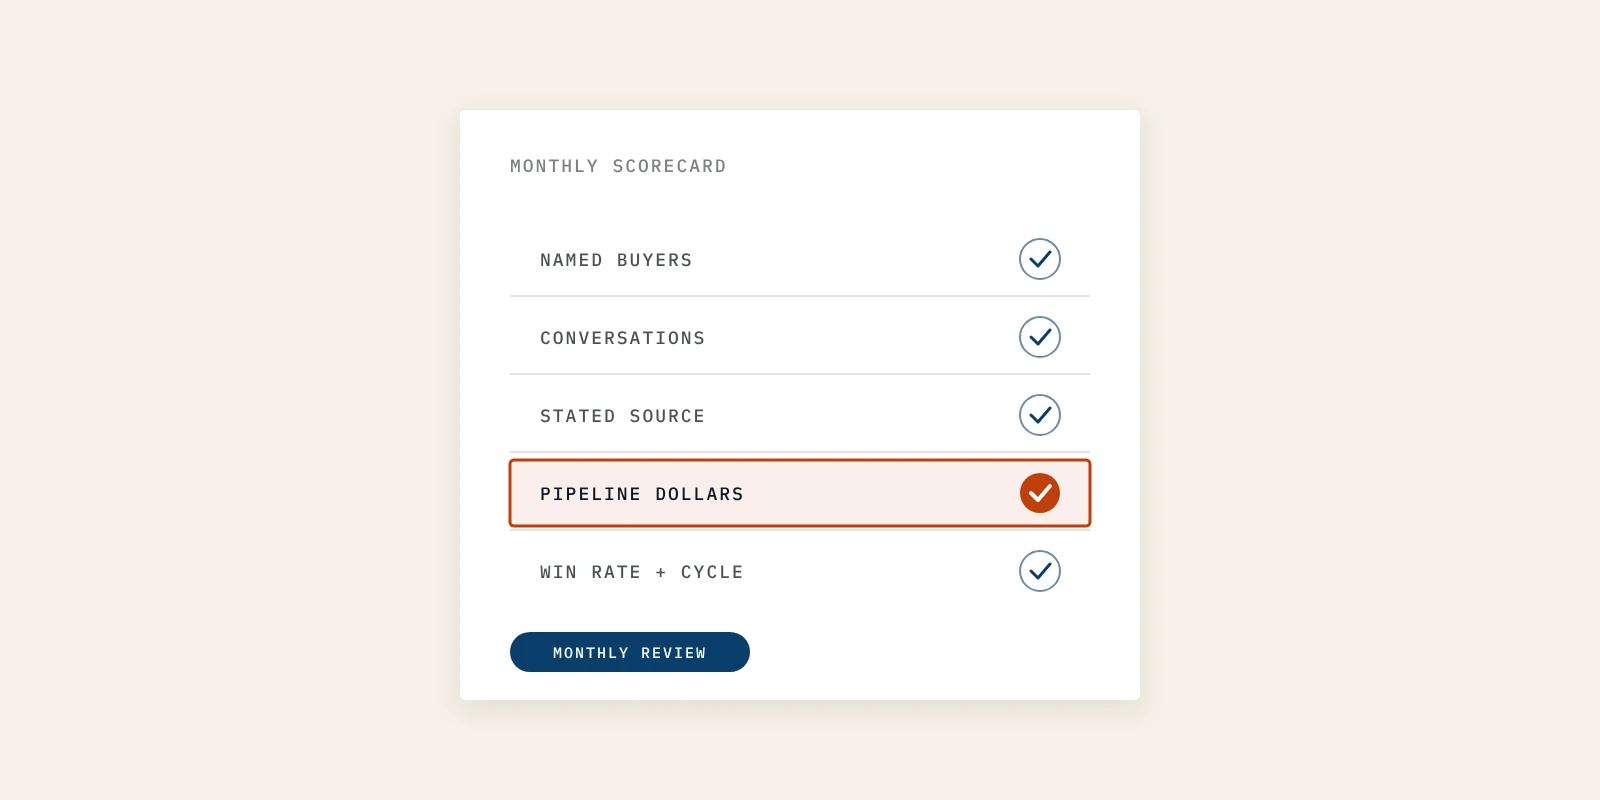
At an early-stage B2B startup with no ad budget, five demand generation metrics carry the weight: named buyers who engaged, first conversations booked, the stated source of each conversation, opportunities with pipeline dollars, and win rate with sales cycle once deals close. Each can be counted by hand from a spreadsheet and the CRM. Rates, customer acquisition cost and lifetime value wait for volume, and a B2B demand generation agency should report against the same five lines.
When I searched demand generation metrics on 7 October 2026, seven of the top eight Google results came from companies selling software or agency services. Demand generation is the work of making the right buyers know and trust you before they start shopping, and those lists measure it the way a department with ad spend would.
Cognism's list runs to 12 metrics and opens with MQLs, SQLs and cost per lead. If your old network has stopped sending intros, you have no ad budget and perhaps a few deals a quarter, so most of those numbers will read zero or noise.
In this post I cover the five demand generation metrics I track first, the ones I skip, when rates earn a place, the monthly review and what to ask an agency.
The Five Demand Generation Metrics I Track First
I track five demand generation metrics first: named buyers who engaged, first conversations booked, the stated source of each conversation, opportunities with pipeline dollars, and win rate with sales cycle. Each one is a count I can make by hand, and each answers a question the one before it cannot.
Together they are the only key performance indicator set I trust at seed. A key performance indicator is a measure tied to a goal you have actually set, and my goal at this stage is more qualified sales conversations with the buyers I named.
1. Named Buyers Who Engaged
This line counts the people on my target list who did something visible this month. They replied to a post, answered a newsletter, commented or forwarded my writing to a colleague.
I count names, not impressions, because an impression cannot book a call. I keep them in a plain spreadsheet with one row per person and the date of their last action, and a count that stalls for two months tells me the message has gone stale.
2. First Conversations Booked
This line counts first calls with someone who fits the buyer profile, booked because of something demand generation put in front of them. A demo request from a student or a vendor pitch does not count.
I log every first conversation in the CRM on the day it is booked. This is the number I watch most closely, because it is the first one that shows a buyer chose to spend time with you.
3. The Stated Source of Each Conversation
For every first conversation, I record where the buyer first heard of us, in their own words. I ask on the form and again on the call, a method I lay out in full in my guide to self-reported attribution.
At seed, this replaces demand generation attribution software. Five buyers who each name the same podcast appearance tell me more than a dashboard that files those deals under direct traffic.
4. Opportunities and Pipeline Dollars
This line counts first conversations that became a real opportunity, meaning the buyer has a problem, a budget owner and a timeline. I add the dollar value of each, and the sum is the sales pipeline that demand generation created this month.
I record the value the buyer's own numbers support, not my list price. A sales pipeline padded with hopeful figures tells your board a story that next quarter takes back.
5. Win Rate and Sales Cycle Once Deals Close
This line waits until deals start closing. Win rate is opportunities won divided by all opportunities that reached a decision, and the sales cycle is the number of days from first conversation to signature.
I add it only after the first deals from demand generation have reached a decision, won or lost. Before that, any cycle length is a guess, and a guess typed into a spreadsheet starts to look like a fact.
Here is the whole scorecard in one place, the way I keep it on a single tab. The stage definitions behind it are in my write-up of how a demand generation funnel works for a small team.
| Line | What It Tells You | How I Count It | When It Earns a Place |
|---|---|---|---|
| Named buyers who engaged | The message reaches the right people | Spreadsheet of target names with the date of their last action | From week one |
| First conversations booked | Buyers chose to spend time with you | CRM entry on the day the call is booked | From week one |
| Stated source | Which channel started each conversation | Open-text answer on the form and on the call | From the first conversation |
| Opportunities and pipeline dollars | Interest turned into a buying process | CRM opportunity with a value the buyer supports | From the first qualified call |
| Win rate and sales cycle | How often and how fast pipeline closes | Won deals divided by decided deals, and days to signature | After the first deals reach a decision |
Pro tip: Fill the five lines by hand for the first quarter. Typing each name forces you to look at who the buyers are, which a chart never does.
Why Vendor Lists of Demand Generation Metrics Mislead a Small Team
Vendor lists of demand generation metrics mislead a small team because each metric assumes something you do not have yet: lead volume, ad spend or data software. The lists are not wrong for their authors' customers, who run marketing departments.
When I read the top results on 7 October 2026, Upland listed five metrics and Cognism listed 12. Most lists of demand generation KPIs start from lead or cost figures, and Cognism opens with MQLs, SQLs and cost per lead while Upland opens with cost per acquisition.
Metrics That Assume Lead Volume
Marketing qualified leads, lead-to-opportunity rates and lead scoring need a steady flow of leads before the numbers mean anything. At seed, one good week can double a rate and one quiet week can halve it.
This is also where demand generation gets confused with lead generation, which counts contacts captured. I count conversations instead, because a contact who never talks to you is not demand.
Metrics That Assume Ad Spend
Cost per lead, cost per click and return on ad spend all divide by a media budget. With no ad budget, the real cost is your own hours, and I would rather track those hours directly.
The name adds confusion. Google Ads sells a campaign type called Demand Gen, which serves ads on YouTube, Discover, Gmail and the Google Display Network, so many results for these terms describe ad reporting rather than demand generation as a practice.
Metrics That Assume Software You Do Not Own
Intent surges, share of voice and multi-touch attribution need a data vendor or an analytics stack that a small team rarely has. Google's AI Overview for this query on 7 October 2026 named ZoomInfo and 6sense as sources of intent signals.
I skip all three until the five lines are stable. They answer questions about scale, and your question right now is who is buying.
| Vendor Metric | What It Assumes | What I Track Instead |
|---|---|---|
| Marketing qualified leads | Steady lead volume | First conversations booked |
| Cost per lead | A paid media budget | Founder hours per first conversation |
| Intent surge | An intent data subscription | Named buyers who engaged |
| Share of voice | A monitoring tool and a known category | Stated source of each conversation |
| Multi-touch attribution | Tracked clicks across many deals | Stated source in the buyer's own words |
| Lifetime value | Years of retention data | Pipeline dollars, then win rate |
There is a second trap in adopting any list whole. Goodhart's law is usually stated as "When a measure becomes a target, it ceases to be a good measure." A founder chasing MQLs will find ways to produce MQLs that never buy.
When to Add Rates, Customer Acquisition Cost and Lifetime Value
I add conversion rates, customer acquisition cost and lifetime value only when the counts underneath them can survive one unusual month. Until then, the five counts carry the demand generation scorecard on their own.
1. Conversion Rates Between Lines
I do not quote a rate until the line below it has at least 30 events in the period I am reporting. Below that, I show the two counts side by side, for example 9 opportunities from 22 first conversations, so the reader can see the size.
That one rule ends most arguments about why a rate moved. With small numbers, it usually moved because one deal did.
2. Customer Acquisition Cost
Customer acquisition cost is what you spent to win customers divided by the customers you won. Without ad spend, the largest cost is founder time, so I put an hourly value on my own hours before I calculate it.
I calculate customer acquisition cost once a quarter, never monthly, and only after several customers have closed from demand generation. A monthly figure at seed swings too far on a single signature to guide any decision.
3. Lifetime Value and Payback
Lifetime value needs real retention data, which a young company does not have. I leave it off the scorecard until customers have renewed at least once, and I say so when a board deck asks for it.
Payback period follows the same rule. A lifetime value built on a year of guesses is a forecast, and I label it as one.
Pro tip: When someone asks for a rate you lack the volume for, answer with the two counts and the month you expect to reach 30 events. It sounds steadier than a percentage that changes every month.
How I Run a Monthly Demand Generation Metrics Review
I review demand generation metrics once a month in a 45-minute session, with the five lines on one tab and the raw names beside them. Weekly reviews at seed mostly measure noise, and a quarterly review is too slow to catch a stale message.
This is how to measure demand generation without a demand generation dashboard or a data team:
Update the five counts from the spreadsheet and the CRM, by hand.
Read every stated source answer from the month, word for word.
Mark which channel started each new opportunity.
Pick one channel to give more hours and one to pause.
Write three sentences on what changed and what you will try next month.
The last step matters most. A review that ends without a decision becomes a reporting ritual, and the scorecard slowly turns into the vanity board it was meant to replace.
What to Ask a B2B Demand Generation Agency to Report
Ask a B2B demand generation agency to report the same five lines you track, with the names behind each number. If an agency reports reach and leads but cannot name the conversations its work started, you cannot tell its demand generation from activity.
The Names Behind Every Number
I want the list of engaged names and first conversations, not only the totals. For example, a total of 40 engaged buyers means little until you can see how many work at accounts you would actually sell to.
Names also let you check the agency's numbers against your own sales calls. That is the only audit most founders have time for.
Pipeline Dollars Instead of Lead Counts
Ask for opportunities and pipeline dollars created, with the stated source for each. This ties the agency's incentive to buyers who want to talk, not to form fills that you then have to sort through.
What Stopped Working
Ask for one line each month on what the agency tried and stopped. We think an agency that never reports a failed experiment is either not experimenting or not telling you.
Pro tip: Write the five-line scorecard into the contract as the monthly report format. It is far easier to agree on before the first invoice than after the third.
How Long Demand Generation Metrics Take to Move
Demand generation metrics move in order, and the later lines take at least one sales cycle to show anything. Named buyers who engaged can move within weeks of a sharper message, while pipeline dollars lag first conversations by however long your buyers take to decide.
That is why I judge a new channel on the first two lines for its first 90 days, and on pipeline only after a full sales cycle has passed. Judging a channel on revenue in its first month kills channels that were working.
I will also say what this scorecard cannot do. It will not tell you how big your market is, and no set of pipeline metrics will rescue a product nobody needs.
Start the Five-Line Demand Generation Scorecard This Month
Most demand generation metrics on vendor lists were built for teams with ad budgets and data tools. At your stage, five counts do the work: engaged names, first conversations, stated source, pipeline dollars, then win rate and sales cycle.
Add rates and customer acquisition cost when the counts can carry them, and hold any B2B demand generation agency to the same five lines. If you want help building that scorecard and the channels behind it, that is the work we do at Better Marketing.