Quick Answer
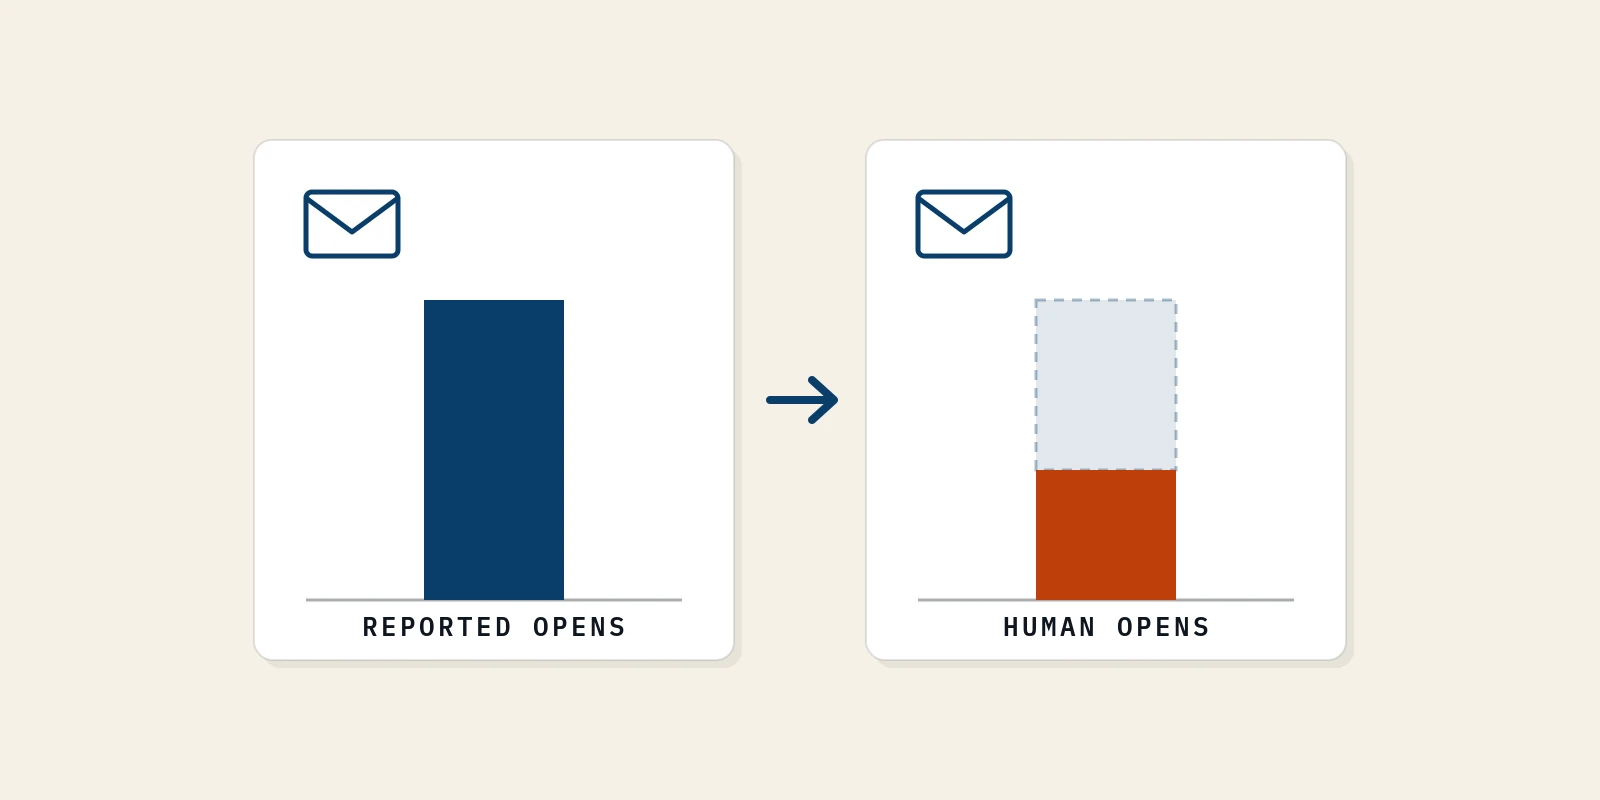
A good open rate for a B2B newsletter depends on which opens the tool counts. With Apple and bot opens included, 35% to 45% matches large 2023 to 2025 datasets, such as Mailchimp's 35.63% and MailerLite's 39.31% for software. With those opens filtered out, none of the published benchmarks reviewed matches, so the fair test is the newsletter's own trend. Click rate, click-to-open rate and replies then show if people read it.
Open rate is the share of delivered emails that register an open, and that register is nothing more than a tiny invisible image loading. When I lined up the published open rate benchmarks on 23 September 2026, the software figures ran from 17.86% at beehiiv to 39.31% at MailerLite.
A founder who sends a first issue and sees, say, 52% has no way to tell if that number is great or mostly machines. I have watched this stall good newsletters, because the number looks like feedback and often is not.
In this blog I'll cover what a good B2B newsletter open rate looks like, why benchmarks disagree, how bots inflate the count and what I track instead.
A Good B2B Newsletter Open Rate Depends on Which Opens Your Tool Counts
A good open rate for a B2B newsletter is 35% to 45% if your tool counts Apple and bot opens. If your tool filters them out, a good open rate is one that beats your own recent average on the same setting.
I give two answers because one list produces two very different open rates depending on a single report setting. Here is how I read the number under each one.
| Your tool's setting | What it counts as an open | What I'd call good | Where the yardstick comes from |
|---|---|---|---|
| Apple and bot opens included | Every tracking pixel load, human or machine | 35% to 45% | Mailchimp all users 35.63% (data as of December 2023); MailerLite software and web apps 39.31% (2025 campaigns) |
| Apple and bot opens filtered out | Pixel loads the tool believes came from people | Above your last 5 to 10 sends | None of the five benchmark pages I read on 23 September 2026 publishes a filtered software figure |
| Setting changed partway through | A mix of both, split by send date | Nothing yet | Re-baseline from the date the setting changed |
• When Apple and Bot Opens Are Included
Most published tables count every open, so this is the setting where a benchmark comparison is fair. MailerLite's 2025 data covers over 3.6 million campaigns from 181,000 accounts. Its median open rate across all of them was 43.46%, and software and web app senders came in at 39.31%.
Mailchimp's page reports 35.63% for all users and 31.35% for Business and Finance. It only counts campaigns sent to at least 1,000 subscribers, and the data was last updated in December 2023.
Both companies say Apple's privacy feature affects these numbers. MailerLite states plainly that real open rates are lower than the ones in its own tables. So when my unfiltered email newsletter open rate sits between 35% and 45%, I call it normal, not exceptional.
If it sits well under 30% on an unfiltered report, I check deliverability before I touch the writing. My checklist for that lives in our post on email deliverability for small lists.
• When Apple and Bot Opens Are Filtered Out
Filtering removes a large share of recorded opens, so the number usually lands below the published tables. Mailchimp's own help page warns that open and click metrics "will drop significantly" when bot filtering is on.
That drop is the point, since what remains is closer to people reading. The problem is that nobody publishes a matching benchmark. Comparing a filtered rate of, say, 24% against Mailchimp's 35.63% makes a healthy newsletter look weak.
So on a filtered report, I compare each send against the average of the previous 5 to 10 sends. A send that beats that average earned more real opens than usual. A send far below it tells me something changed in the subject line, the timing or the inbox placement.
• When the List Is Still Under a Few Hundred People
On a small list, one person moves the open rate a lot. Say you have 150 subscribers. Each reader is worth 0.67 percentage points, so eight people opening a day late swings the rate by more than five points.
Mailchimp's benchmark does not describe a list that size at all, since it leaves out campaigns sent to fewer than 1,000 subscribers. I treat single sends on a small list the way our post on small samples in startup metrics treats early batting averages, as interesting but not yet meaningful.
For the first few months, I read a rolling average across four sends. It smooths out the reader who was on vacation or the colleague who opened three issues in one sitting.
Pro tip: Every time you log an open rate in a spreadsheet, write the filter setting and the tool next to it. Six months later, that note is the only way to know which numbers you can compare.
Why Open Rate Benchmarks for Software Range From 17.86% to 39.31%
Published open rate benchmarks disagree because they measure different years, different senders and different definitions of an open. None of them is wrong, but they do not measure the same thing, so the average newsletter open rate you find depends on the page you land on.
This is the comparison I wish someone had handed me before I quoted a benchmark to a founder.
| Source | Figure for tech or software | All-industry figure | Data period | Apple privacy opens |
|---|---|---|---|---|
| Campaign Monitor | IT, Tech and Software 22.7% | 21.5% | 2021 sends, 2022 report | Mostly before Apple's change |
| beehiiv | Technology Services 17.86% | 33.86% | Page updated July 2026, dataset not named | Not stated |
| monday.com | SaaS and technology 17% to 21% | 15% to 25% | 2026 guide, dataset not named | Page says Apple makes rates less reliable |
| Mailchimp | Business and Finance 31.35% (no software row) | 35.63% | Data as of December 2023 | Included, with a warning |
| MailerLite | Software and web app 39.31% | 43.46% | 2025 campaigns | Included, with a warning |
1. The Data Year Decides If Apple Opens Are Inside the Number
Mailchimp's Apple privacy FAQ dates Apple's Mail Privacy Protection to 2021, with iOS 15 and macOS Monterey. Campaign Monitor's 21.5% average comes from 2021 sends, so most of it predates the change.
MailerLite's 43.46% comes from 2025, when the feature had been live for years. I think most of the roughly 22-point gap between those two tables comes from the calendar, not from newsletters getting better.
2. The Sample Decides Whose Lists You Are Measured Against
Mailchimp counts only campaigns sent to 1,000 or more subscribers. MailerLite's pool spans 181,000 accounts. beehiiv says its figures mostly come from small businesses.
A founder list of 300 engineers falls below Mailchimp's cutoff and is a speck inside the other two pools. That does not make the tables useless, but I use them as a rough range, never as a pass mark.
3. Some Benchmark Pages Name No Dataset at All
monday.com's 2026 guide gives ranges like 17% to 21% for SaaS and technology without naming where they came from. beehiiv's industry list also does not name its dataset.
Here's what worries me about that. When I searched "what is a good newsletter open rate" on Google on 23 September 2026, the AI Overview repeated monday.com's unsourced ranges as its industry breakdown. I only quote a newsletter open rate benchmark that names its sample and its period.
How Apple Mail Privacy Protection and Security Bots Inflate Open Rate
Apple Mail Privacy Protection and automated security tools load the tracking pixel without a person reading anything. The open rate then counts machines as readers.
The scale is large. Litmus calculated from over 1 billion opens that Apple accounted for 62.26% of opens in July 2026, with Gmail at 27.03% and Outlook at 5.83%. Litmus also writes that Mail Privacy Protection now affects roughly 55% to 60% of all email opens.
• Apple Mail Preloads the Pixel Before Anyone Reads
Apple's own guide says the feature hides the reader's IP address and stops senders from seeing if a message was opened. In practice, Mailchimp explains, Apple Mail preloads the pixel even when the contact has not opened the email.
That pixel is a web beacon, the same email tracking method every open rate depends on. Once Apple loads it on the reader's behalf, a recorded open stops meaning a read.
• Security Scanners Open and Click on Behalf of the Company
Mailchimp describes bot activity as non-human interaction, "such as antivirus scans," that inflates open and click metrics. It names anti-spam security from email providers and link preview generators as common sources.
I pay extra attention to this on a B2B newsletter. My working assumption is that work inboxes see more of this scanning, so an unfiltered B2B email open rate and click-through rate can both run high.
• The Two Effects Do Not Cancel Each Other Out
A list full of personal iPhone users reads high because of Apple. A list full of corporate inboxes may have fewer Apple opens but more scanner activity.
I have stopped guessing which effect dominates a given list. I check the email client report and the bot filter instead, then compare like with like.
Pro tip: Once a quarter, open your email client report and note the Apple Mail share of opens. If it jumps, expect your unfiltered open rate to jump with it, with no change in real reading.
How to Check Which Opens Your Email Service Provider Counts
Look for an Apple privacy or bot filter in your email service provider's report settings before you compare anything. The defaults differ by tool, and a few tools offer no filter at all.
| Email service provider | Apple privacy opens by default | Can you exclude them | Source |
|---|---|---|---|
| Mailchimp | Bot filtering on by default, covering Apple privacy opens, security scans and link previews | Yes, and dashboards can exclude Apple opens for emails sent on or after June 22, 2024 | Mailchimp bot help and Apple FAQ |
| ActiveCampaign | Included since August 2022 | Yes, with a filter on each report | EmailTooltester |
| Brevo | Included since February 6, 2025 | Yes, with a manual setting | EmailTooltester |
| Klaviyo | Not excluded from campaign reports by default | Yes, through custom reports and segments | EmailTooltester |
| Kit | Included | No way to identify or exclude them | EmailTooltester |
1. Find the Filter and Write Down Its Default
I open the analytics or report settings and look for words like "bot filtering," "Apple privacy opens" or "MPP." If I find none, I assume every open is counted.
2. Note the Date Any Filter Took Effect
Mailchimp's filtered history for Apple opens starts on July 10, 2024, per its bot activity page. Brevo changed its default in February 2025. An open rate chart that crosses one of those dates can show a jump or a drop caused by the tool, not the newsletter.
3. Re-Baseline After Every Change
When I switch a filter on, I restart the trailing average from that send. Mixing filtered and unfiltered sends in one average is how a founder ends up thinking a good newsletter got worse.
What to Track Next to Open Rate in a B2B Newsletter
Next to open rate, I track click rate, click-to-open rate and replies, because each one needs a human to do something. For a B2B newsletter selling to a small market, replies matter most.
When we set up reporting for a B2B newsletter, I put these three numbers above the open rate on the page.
• Click Rate Against the Software Benchmark
Apple's feature does not extend to links, and Mailchimp confirms clicks are still reported for Apple Mail users. For a good click rate for email in software, MailerLite puts the 2025 median at 2.09% for all campaigns and 1.15% for software and web apps.
The SunLead newsletter we write runs at a 46% open rate and a 9% click-through rate, as shown in the SunLead case study. I read the 9% first, since a click is much harder for a machine to fake once bot filtering is on.
• Click-to-Open Rate as a Content Check
Click-to-open rate divides clicks by opens, so it asks if the issue delivered on its subject line. MailerLite reports a median of 6.81% overall and 5.4% for software and web apps.
MailerLite also notes that inflated opens push the real click-to-open rate higher than the reported one. I use it to compare issues against each other, not against a table.
• Replies and Named Accounts on a Small List
On a list under 1,000, I count replies per send and list which target accounts clicked. Five replies from people at companies you want as customers beat a two-point open rate gain.
Our post on starting a newsletter that wins first customers goes further on why replies predict revenue better than reach.
Pro tip: Ask one direct question at the end of every issue. It gives readers an easy reason to reply, and replies are the one engagement signal no scanner can produce.
When Open Rate Still Tells You Something Useful
Open rate still helps in three narrow jobs. It can spot a sudden deliverability problem, compare sends under one setting, and sanity-check a subject line. Outside those jobs, I don't lean on it.
• A Sudden Drop Across Several Sends
If the open rate falls by a third across three sends with no setting change, I suspect inbox placement before content. That is when I work through the checks in our small-list deliverability guide.
• Comparing Sends Under One Setting
Two issues sent to the same list, with the same filter, a week apart, can be compared fairly. That comparison is where the open rate is most honest.
• Subject Line Checks Judged on Clicks
Mailchimp warns that A/B tests based on open rates may be inaccurate under Apple's feature and suggests click rates instead. I still glance at opens during a subject line test, but I pick the winner on clicks.
What does not work, in my experience, is chasing the open rate with curiosity-bait subject lines. It can lift a vanity number while the click-to-open rate falls.
Set the Filter Once, Then Judge Your B2B Newsletter by Its Own Trend
I'd start by finding your tool's bot and Apple filter and writing down its setting. On an unfiltered report, 35% to 45% is a normal open rate for software senders today. On a filtered report, judge each send against your own recent average.
Then read clicks and replies, because they tell you if your B2B newsletter is building trust. If you want a second pair of eyes on those numbers, Better Marketing runs founder newsletters built around replies, not opens.